

Kentucky Fatal Car Accident Statistics
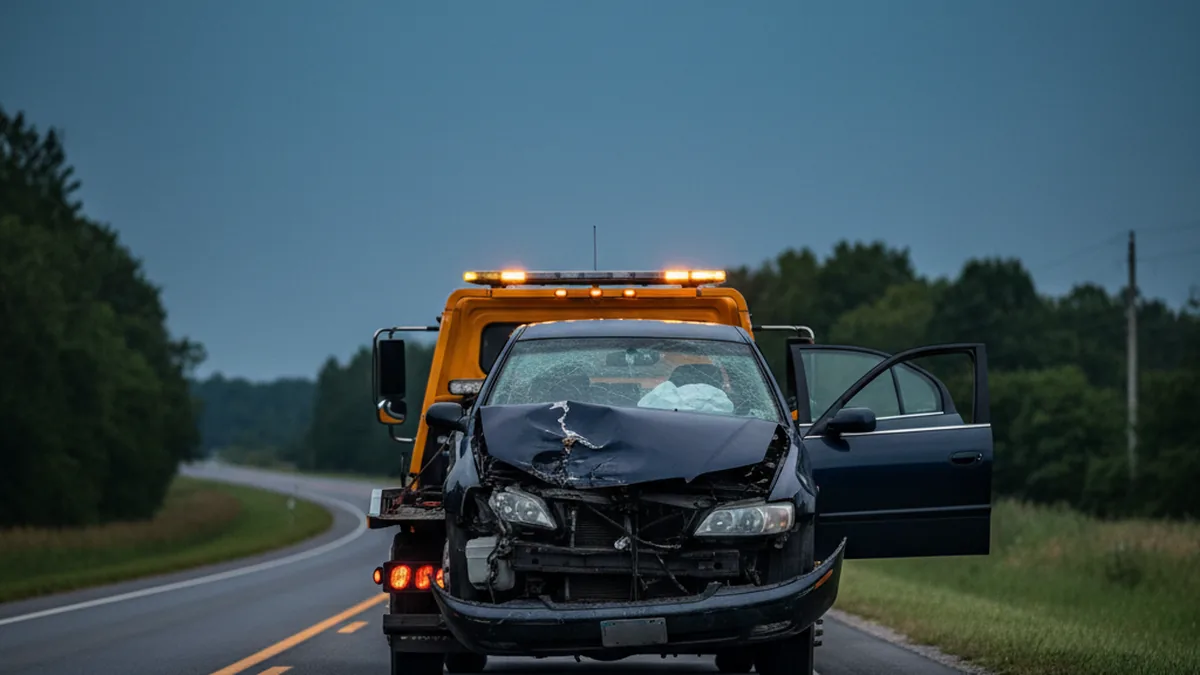
Kentucky recorded 707 people killed on public roads in 2024, down from 814 in 2023, according to the Kentucky Transportation Cabinet 2024 Traffic Collision Facts report. The report also counted 659 fatal public-road collisions and 29,235 people injured. Those numbers describe the statewide burden; they do not identify fault in an individual crash or what a particular family may recover.
Kentucky 2024 Traffic Collision Facts Report
The 2024 facts book is Kentucky’s newest complete collision report and covers calendar year 2024. KYTC builds it from a finalized data snapshot and treats Fatality Analysis Reporting System (FARS) adjustments as authoritative, so it is a stronger source than a news recap or an early estimate. Totals still need care when compared across tables.
Statewide Fatal Crash Totals for 2024
Kentucky had 117,661 collisions on public roads in 2024. Of those, 659 were fatal collisions and 19,834 were nonfatal injury collisions. Public-road fatalities fell from 814 in 2023 to 707 in 2024, and the Kentucky death rate fell from 1.66 to 1.44 deaths per 100 million vehicle miles traveled.
Even after the decline, 707 deaths means nearly two people were killed on an average day. The report also counted 2,802 suspected serious injuries on public roads.
KYTC lists deaths on public roads separately from deaths on parking lots or private property, and later FARS review can change a location or classification. This article uses the public-road total for statewide roadway comparisons unless stated otherwise.
Jefferson County Fatal Crash Data
Jefferson County had more traffic deaths than any other Kentucky county in 2024. KYTC recorded 25,417 total collisions, 109 fatal collisions, 113 people killed, and 6,183 people injured in the county. The 113 deaths were lower than the 134 reported for 2023.
Louisville organizes its road-safety work through Vision Zero Louisville, which uses the Safe System approach and has a stated goal of eliminating traffic deaths by 2050. Its materials emphasize safer roads, speeds, people, vehicles, and post-crash care.
County totals combine many road types and road users, so they do not show that a particular interstate, intersection, or neighborhood caused a crash. Evidence for a specific case is narrower: the police file, vehicle damage, roadway design, available video, witness accounts, medical records, and electronic data tied to that collision.
Fatal Crashes by Collision Type
Collisions with another moving vehicle accounted for 294 deaths in 2024. Fixed-object collisions accounted for 219 deaths, pedestrian collisions for 97, and pedalcyclist collisions for 14. These categories overlap with the report’s user and vehicle tables, so they should not be added together as separate totals.
Severity differs from frequency. In two-vehicle crashes, head-on collisions were about 3% of the total but about 35% of fatal collisions. Angle collisions were about 32% of two-vehicle collisions and nearly 44% of the fatal collisions in that group. Rear-end collisions were much more common than head-on crashes but a smaller share of fatal events.
Kentucky’s 2025 to 2029 Strategic Highway Safety Plan names aggressive driving, distraction, impairment, roadway departure, vulnerable road users, motorcyclists, commercial vehicles, older drivers, and teen drivers as emphasis areas. Those emphasis areas are prevention priorities; negligence in a civil case still depends on the evidence in that case.
Rural and Urban Collision Severity
Rural collisions were more severe relative to their share of the total, although urban areas had more crashes and more deaths. Rural areas accounted for 35.5% of public-road collisions and 45.1% of the people killed.
| Area | Share of All Collisions | Share of Fatal Collisions | Share of People Killed |
|---|---|---|---|
| AreaRural | Share of all collisions35.5% | Share of fatal collisions45.1% | Share of people killed45.1% |
| AreaUrban | Share of all collisions63.7% | Share of fatal collisions53.9% | Share of people killed53.8% |
Source: Kentucky Transportation Cabinet. Public-road collisions, 2024. Unknown land use is under 1.1% in each column.
Road type adds another layer. State-numbered routes carried 35% of all collisions but 43% of fatal collisions, while city streets carried 21% of all collisions and only 5% of fatal collisions. Curved roads accounted for 15% of all collisions but 28% of fatal collisions.
A quiet rural route can carry higher crash severity. Speed, curves, roadside objects, distance to emergency care, lighting, and the type of collision can all affect severity, and responsibility for a crash requires investigating the actual roadway and conduct involved.
Light Conditions, Weekends, and Road Surface
Darkness was present in a much larger share of fatal crashes than of crashes overall. KYTC reported 28,855 collisions during dark conditions, 24.5% of collisions with a known light condition, and 289 fatal collisions in the dark, 43.9% of fatal collisions with a known light condition.
Saturday and Sunday together accounted for 22% of all collisions but 32% of fatal collisions. By month, October had the most total collisions, while May had the most fatal collisions. Those are statewide calendar patterns, not a prediction about any particular trip.
Nearly 85% of fatal collisions occurred on dry pavement. Most travel happens on dry roads, so poor weather alone does not explain most fatal crashes.
Age and Sex of People Killed
The 2024 report identified 501 men and 198 women among those killed; small discrepancies are possible because sex or age may be unknown when a crash is coded. People ages 15 through 24 accounted for 15.7% of all traffic deaths, and the age distribution differed between men and women.
Demographic data can shape prevention work but does not decide an individual claim. Age and sex do not establish who had the right of way, whether a driver was impaired, whether a vehicle was defective, or whether a roadway condition contributed. For a family, the decedent’s age, health, work, household role, and relationships can affect damages, and those facts require their own documentation.
Kentucky Wrongful Death Law
KRS 411.130 provides that when a death results from another person’s negligence or wrongful act, damages may be recovered from the responsible person or from a principal whose agent or servant caused the death. More on these claims is on the firm’s wrongful death page.
Personal Representative and Distribution of Recovery
The deceased person’s personal representative prosecutes the wrongful death action. The recovery is distributed in the order KRS 411.130 sets out, after specified funeral, administration, and recovery costs and attorney fees not included in the defendant’s payment are addressed. The statute also allows punitive damages when the act was willful or the negligence was gross, and whether that standard is met depends on the evidence.
Survival Claims Under KRS 411.140
KRS 411.140 preserves most personal injury claims after the injured person dies. That can create a survival claim for losses the person experienced before death, separate from the wrongful death claim for the death itself. The available categories and evidence depend on the facts and the pleadings.
Limitation Periods Under KRS 304.39-230
No single deadline covers every fatal vehicle case. KRS 304.39-230 contains timing rules for motor vehicle tort actions and survivor benefits, and other statutes and circumstances can apply. The specific crash, benefit-payment history, estate appointment, and potential defendants all need prompt review.
Truck, Motorcycle, Pedestrian, and Bicycle Deaths
KYTC counted 9,446 collisions involving trucks with a registered weight of at least 10,000 pounds in 2024, including 73 fatal collisions, 80 people killed, and 1,898 injured. A truck case may require carrier records, driver qualification materials, electronic logging information, inspection records, and evidence about loading or maintenance. The firm’s trucking accident liability page explains how those cases are investigated.
KYTC also counted 1,665 motorcycle collisions, 99 fatal motorcycle collisions, and 104 people killed in motorcycle-related crashes. Motorcycles were less than 1% of vehicles involved in all collisions but about 9% of vehicles involved in fatal collisions. The motorcycle accident page covers the legal issues that follow those crashes.
Pedestrian collisions killed 97 people, and pedalcyclist collisions killed 14. The pedestrian accident page discusses those claims in more detail.
Statewide statistics show patterns, and a fatal crash still needs its own investigation. Vehicles, photographs, video, electronic data, witness information, roadway evidence, medical and coroner records, and commercial records can be lost or overwritten if they are not secured.
Ready to Take Action on Your Injury Claim?
After a serious injury, medical bills pile up while the insurance company looks for ways to pay you less. Most law firms take their cut first and leave you with whatever is left. Sam Aguiar Injury Lawyers does things differently. With our exclusive Bigger Share Guarantee®, you always get more. Every client gets a dedicated three-person team: an attorney, a case manager, and a legal assistant. We never raise our fee rate if we have to go to court, and you pay $0 Out-Of-Pocket Forever.
Frequently Asked Questions
1How many people died in Kentucky traffic crashes in 2024?+
2How many people died in Jefferson County crashes in 2024?+
3Were rural or urban Kentucky crashes more likely to be fatal?+
4Does Kentucky crash data determine who was at fault?+
5How many fatal Kentucky crashes involved trucks in 2024?+
6Who files a Kentucky wrongful death action?+
Latest Articles
Kentucky Diminished Value Claims
Kentucky drivers may pursue a repaired vehicle’s leftover market loss from the at-fault driver as part of a.
FMCSA Revoked ELDs: Fleet Compliance and Enforcement Deadlines
FMCSA removed five electronic logging devices from the registered list on August 6, 2026, and set an October.

FMCSA English Proficiency Rule and OOS Enforcement
FMCSA English Proficiency Rule Sam Aguiar Injury Lawyers August 11, 2026 7 minute read On This Page.