

Kentucky Car Accident Statistics for 2024
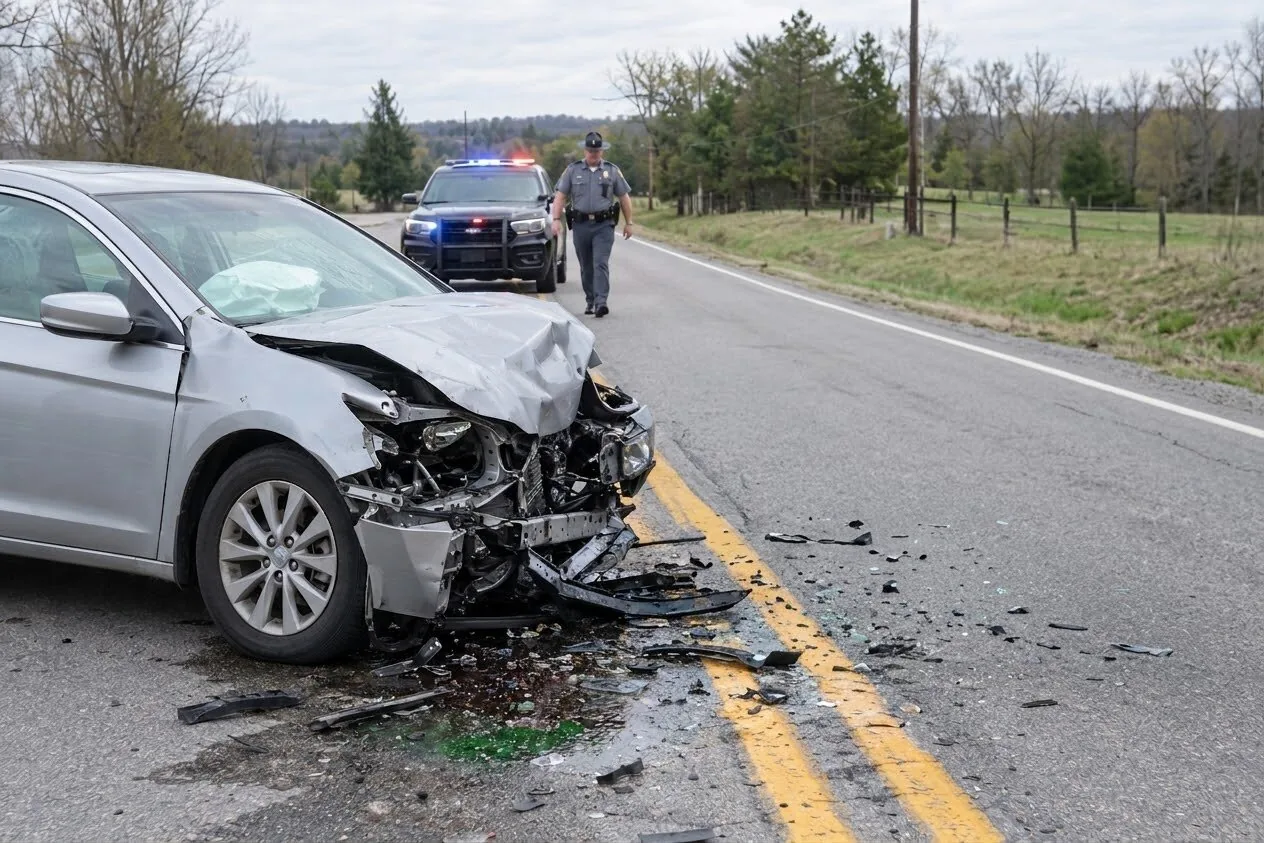
Kentucky recorded 117,661 collisions on public roads in 2024, and 707 people were killed in them, according to the 2024 Kentucky Traffic Collision Facts report published by the Kentucky Transportation Cabinet (KYTC) and the Kentucky State Police. Every figure in this article comes from that report unless another source is linked. The counts describe statewide patterns. They do not decide fault in any single car accident.
Statewide Collision Totals for 2024
Kentucky’s 117,661 public-road collisions in 2024 were 0.2% more than the 117,422 reported for 2023. Of the 2024 total, 659 were fatal collisions, 19,834 were nonfatal injury collisions, and 97,151 involved property damage only. That averages about 321 collisions a day across the 366 days of 2024.
117,661
Collisions on Kentucky public roads in 2024
29,235
People injured on public roads in 2024
707
People killed on public roads in 2024
Source: Kentucky Transportation Cabinet, 2024 Kentucky Traffic Collision Facts.
The injured total includes 2,802 suspected serious injuries. Another four people were killed and 705 were injured on parking lots and private property, which the report counts separately from public roads. The firm’s Kentucky fatal car accident statistics article uses the same report and breaks the 707 deaths down by county, collision type, and light condition.
Traffic Deaths from 2015 to 2024
Public-road deaths fell from 814 in 2023 to 707 in 2024, the lowest count in the report’s 10-year table. The highest year in that table was 2016, with 834 deaths. Kentucky’s death rate per 100 million vehicle miles traveled was higher than the national rate in every year from 2015 through 2024.
| Year | People Killed in Kentucky | Kentucky Death Rate | U.S. Death Rate |
|---|---|---|---|
| Year2015 | People killed in Kentucky761 | Kentucky death rate1.56 | U.S. death rate1.22 |
| Year2016 | People killed in Kentucky834 | Kentucky death rate1.70 | U.S. death rate1.25 |
| Year2017 | People killed in Kentucky782 | Kentucky death rate1.59 | U.S. death rate1.25 |
| Year2018 | People killed in Kentucky724 | Kentucky death rate1.46 | U.S. death rate1.24 |
| Year2019 | People killed in Kentucky732 | Kentucky death rate1.48 | U.S. death rate1.20 |
| Year2020 | People killed in Kentucky780 | Kentucky death rate1.68 | U.S. death rate1.49 |
| Year2021 | People killed in Kentucky806 | Kentucky death rate1.62 | U.S. death rate1.43 |
| Year2022 | People killed in Kentucky762 | Kentucky death rate1.58 | U.S. death rate1.46 |
| Year2023 | People killed in Kentucky814 | Kentucky death rate1.66 | U.S. death rate1.38 |
| Year2024 | People killed in Kentucky707 | Kentucky death rate1.44 | U.S. death rate1.36 |
Source: Kentucky Transportation Cabinet. Deaths on public roads. Rates are deaths per 100 million vehicle miles traveled; the U.S. rate is from NHTSA and National Safety Council estimates as reported by KYTC.
KYTC adjusts death counts to match the federal Fatality Analysis Reporting System (FARS) after investigation, so a total published early in a year can differ from the final report.
Rural Roads and Fatal Collisions
Rural areas had 35.5% of Kentucky’s public-road collisions in 2024 and 45.1% of the people killed. Urban areas had 63.7% of collisions and 53.8% of deaths, so urban roads still produced more deaths in raw numbers. KYTC defines an urban area as a place with a population of at least 5,000, plus the area adjacent to it.
Road type and conditions show the same gap between frequency and severity. State-numbered routes carried 35% of all collisions and 43% of fatal collisions. Curved roads accounted for 15% of all collisions and 28% of fatal collisions. Collisions in the dark were 24.5% of all collisions with a known light condition and 43.9% of fatal collisions.
Contributing Factors Coded by Police
Driver inattention was the most frequently coded human factor in 2024, listed on 42,363 collisions (36% of the total) and 123 fatal collisions. Not under proper control was listed on 14,405 collisions and on 187 fatal collisions (28.38% of fatal collisions), the highest fatal count of any human factor. Failed to yield was listed on 13,678 collisions (11.62%). Officers can code up to three factors for each driver, so one collision can appear under several factors, and a coded factor is not a court finding of fault.
Distraction and Cell Phone Use
Distraction was coded on 4,479 collisions (3.81%) and 21 fatal collisions. Cell phone use was coded on 925 collisions (0.79%) and 6 fatal collisions. KRS 189.292 bars a driver of a moving vehicle from writing, sending, or reading text-based messages, with exceptions that include GPS use and entering a number to make a call. The firm’s Louisville distracted driving article covers phone use in more detail.
Unsafe Speed
Unsafe speed appeared on 1,162 collisions in 2024, less than 1% of the total, but on 98 fatal collisions, or 14.87% of fatal collisions. Too fast for conditions appeared on 3,487 collisions and 30 fatal collisions.
Alcohol-Related Deaths
After FARS follow-up on alcohol test results, KYTC counted 152 people killed in alcohol-involved collisions in 2024, about 22% of all people killed and 16% fewer than the 177 killed in 2023. Another 1,683 people were injured in alcohol-related collisions. Among drinking drivers in fatal collisions who were tested, 82% had a blood alcohol concentration of 0.10 or higher. Under KRS 189A.010, the per se limit is 0.08 for drivers 21 and older and 0.02 for drivers under 21.
Seat Belt Use
Kentucky’s observed seat belt use rate was 87.8% in 2024, down from 89.4% in 2023, according to the annual roadside survey reported by KYTC. Among vehicle occupants in 2024 collisions, 48.9% of those not restrained were killed or injured, compared with 9.7% of restrained occupants. FARS data in the same report show that 47% of vehicle occupants killed were not restrained.
Driver Age and Teen Drivers
Drivers ages 25 to 34 were the largest age group in collisions in 2024: 39,869 drivers in all collisions and 194 in fatal collisions. Teen drivers ages 16 to 19 make up 7% of Kentucky’s licensed drivers, including learner’s permits. In 2024, 17,326 teen drivers were involved in collisions and 62 were involved in fatal collisions. People ages 15 to 24 accounted for 15.7% of everyone killed. The age tables count every driver involved and do not separate drivers at fault from drivers who were not.
Jefferson and Fayette County Totals
Jefferson County and Fayette County had the two highest collision totals in Kentucky in 2024. Kenton County was third, with 4,994 collisions.
Jefferson County
Jefferson County recorded 25,417 collisions in 2024, up from 24,678 in 2023. Deaths fell from 134 to 113, fatal collisions fell from 130 to 109, and people injured fell from 6,470 to 6,183. Louisville’s road-safety program, Vision Zero Louisville, states a goal of zero roadway deaths by 2050.
Fayette County
Fayette County recorded 12,188 collisions in 2024, up from 12,090 in 2023. Deaths fell from 49 to 37, fatal collisions fell from 49 to 34, and people injured fell from 2,497 to 2,423. A Lexington car accident case still depends on the evidence from that collision, not the county total.
Truck, Motorcycle, and Pedestrian Deaths
KYTC counted 9,446 collisions involving trucks with a registered weight of 10,000 pounds or more, with 73 fatal collisions, 80 people killed, and 1,898 injured. The trucking accident liability page explains how those cases are investigated.
Motorcycle collisions numbered 1,665, with 99 fatal collisions and 104 people killed. Of the 103 motorcycle drivers and passengers killed, 54 were not wearing a helmet. Motorcycles were less than 1% of vehicles in all collisions and about 9% of vehicles in fatal collisions. Pedestrian collisions numbered 1,115, killing 97 people and injuring 856. The motorcycle accident page and the pedestrian accident page address those cases.
Economic Cost of Kentucky Collisions
KYTC estimates the economic cost of 2024 public-road collisions at $9.96 billion and the comprehensive cost at $19.39 billion, using National Safety Council cost figures. Economic cost counts lost wages, medical expenses, administrative costs, property damage, and employer costs. Comprehensive cost adds a measure of lost quality of life. Those costs are one reason the firm’s article on Kentucky’s minimum insurance limits compares the state’s $25,000 bodily injury minimum with current medical and vehicle costs.
What Happens After Your Crash Becomes a Statistic?
Every collision counted in Kentucky’s 2024 totals left someone with repair estimates, medical visits, and questions about insurance limits. Sam Aguiar Injury Lawyers answers those questions for crash victims across Louisville, Lexington, and the rest of the state, and more than 1,000 five-star Google reviews come from the people it has represented. Most cases qualify in under 10 minutes. If your crash is one of those numbers, a free case review is where your case begins.
Frequently Asked Questions
1How many car accidents happen in Kentucky each year?+
2How many people died in Kentucky car accidents in 2024?+
3What is the most common cause of car accidents in Kentucky?+
4Are rural roads more dangerous than urban roads in Kentucky?+
5How many car accidents happened in Louisville in 2024?+
6What percentage of Kentucky drivers wear seat belts?+
Latest Articles
Kentucky Diminished Value Claims
Kentucky drivers may pursue a repaired vehicle’s leftover market loss from the at-fault driver as part of a.
FMCSA Revoked ELDs: Fleet Compliance and Enforcement Deadlines
FMCSA removed five electronic logging devices from the registered list on August 6, 2026, and set an October.
FMCSA English Proficiency Rule and OOS Enforcement
FMCSA English Proficiency Rule Sam Aguiar Injury Lawyers August 11, 2026 7 minute read On This Page.